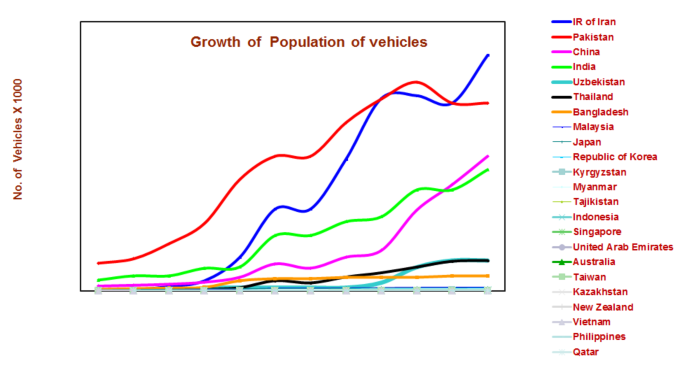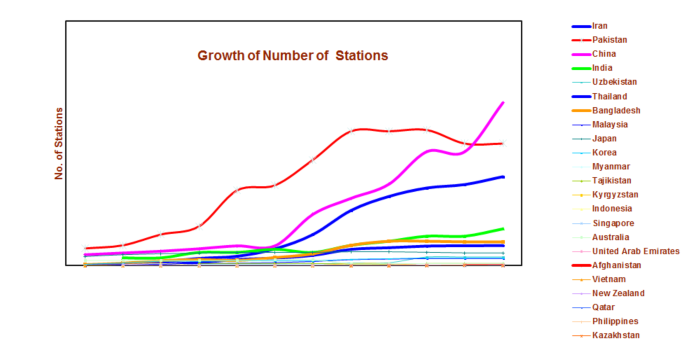
Estimated Number of NGV Vehicles in Asia Pacific and Top Ten NGV Countries Worldwide (July ‘18)
|
No. |
Country |
Total Vehicles |
No. of Stations |
Remarks |
|
1 |
China |
6,080,000 |
8,400 |
Jan ‘18 |
|
2 |
IR of Iran |
4,502,000 |
2,400 |
Nov ‘17 |
|
3 |
India |
3,150,138 |
1,424 |
Jun ‘18 |
|
4 |
Pakistan |
3,000,000 |
3,416 |
Nov ‘16 |
|
5 |
Uzbekistan |
815,000 |
651 |
Jun ‘13 |
|
6 |
Thailand |
474,486 |
502 |
Jul ‘16 |
|
7 |
Bangladesh |
220,000 |
585 |
Apr ‘13 |
|
8 |
Malaysia |
74,000 |
102 |
Jun ‘18 |
|
9 |
Japan |
47,158 |
660 |
Mar ‘18 |
|
10 |
Korea |
39,326 |
198 |
May ‘18 |
|
11 |
Myanmar |
28,297 |
46 |
May ‘16 |
|
12 |
Indonesia |
15,500 |
103 |
Dec ’17 |
|
13 |
Tajikistan |
10,600 |
53 |
Dec ’07 |
|
14 |
Kyrgyzstan |
6,000 |
6 |
Dec ‘07 |
|
15 |
United Arab Emirates |
9,220 |
28 |
Mar ‘18 |
|
16 |
Australia |
3,110 |
52 |
June ‘13 |
|
17 |
Singapore |
1,013 |
1 |
Jan ‘18 |
|
18 |
Kazakhstan |
1,800 |
2 |
Dec‘12 |
|
19 |
Afghanistan |
1,701 |
2 |
Aug ‘13 |
|
20 |
Vietnam |
462 |
7 |
July ‘12 |
|
21 |
New Zealand |
65 |
3 |
Dec ‘12 |
|
22 |
Qatar |
76 |
1 |
Sept ‘13 |
|
|
|
18,479,952 |
18,644 |
|
|

Status of NGV in Asia Pacific Region – 23 Countries at Various Stages of Development and Growth (Sept ‘14)